
Devblog. Part 1
Start of the devblog series
We are launching a series of developer diaries where we will share updates on the features we are currently working on, publish articles about the Daslang language, and compare EdenSpark with other game engines. Enjoy the read!
Disclaimer
I'll clarify right away that this developer diary contains only a partial comparison of the performance of EdenSpark and the Daslang language with Unity and the C# language.
The comparison will be carried out on synthetic tests, which does not fully reflect the picture with a real game load.
As the author of this diary, I have no commercial experience working with Unity and may miss some aspects of Unity and C# optimization.
Benchmark Description
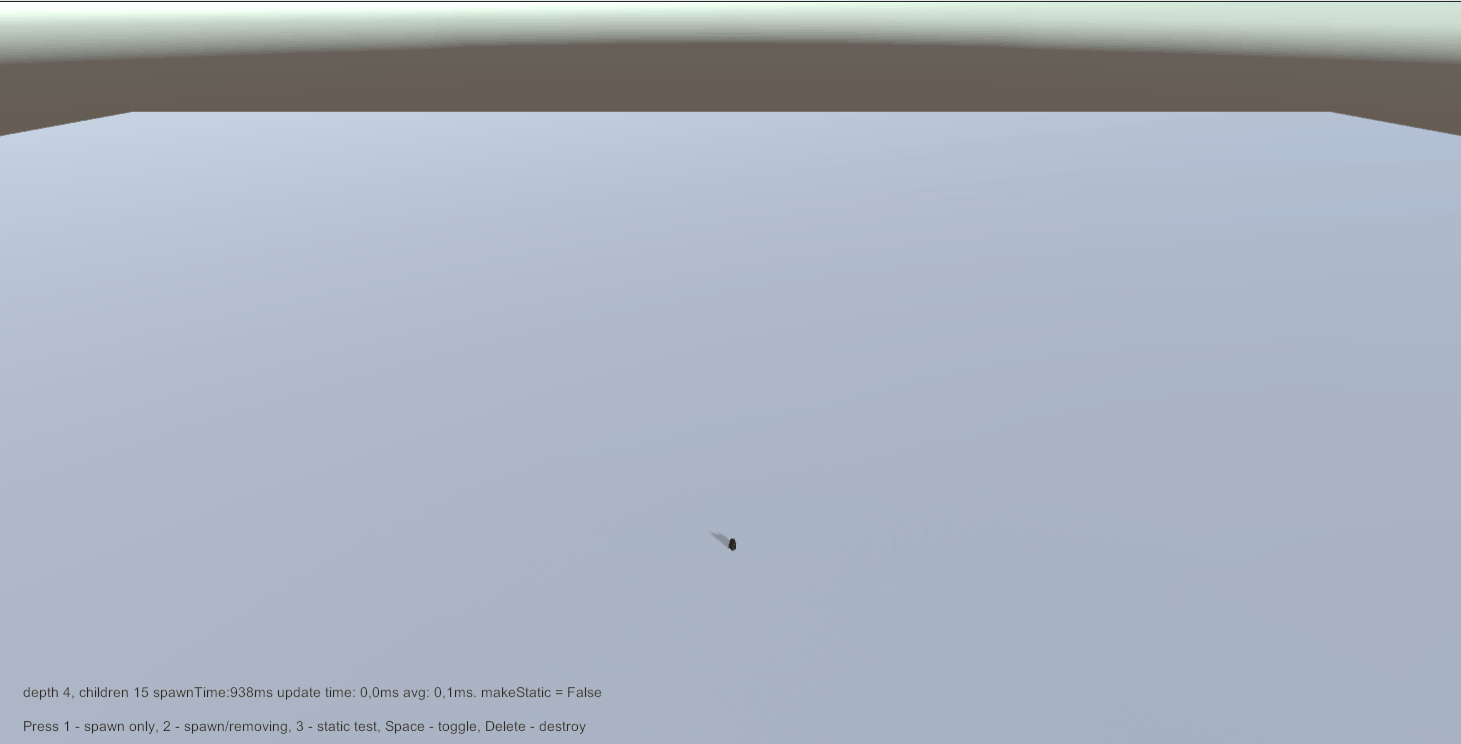
The following stress test was carried out as a benchmark to check the efficiency of the hierarchy tree:
- Each frame, each node of the tree can create another child node, until the depth exceeds 7 or the total number of nodes exceeds 16000.
- Each object uses its own unique color depending on the depth in the hierarchy (black at the root, yellow at the leaves).
This stress test checks the following functionality of the game engine:
- Creation of new nodes.
- Working with a particularly branching hierarchy tree.
- Rendering a large number of similar objects, but with different per-instance data.
Hardware and Software Parameters
Both Unity and EdenSpark will use DX12 as the graphics driver.
Unity 6.2 is used in this instance.
CPU: AMD Ryzen 7 6800H with Radeon Graphics
CPU: AMD Ryzen 7 6800H with Radeon Graphics
Base speed: 3,20 GHz Sockets: 1 Cores: 8 Logical processors: 16 Virtualization: Enabled L1 cache: 512 KB L2 cache: 4,0 MB L3 cache: 16,0 MB
Utilization: 7% Speed: 2,81 GHz Up time: 2:03:13:04 Processes: 299 Threads: 5500 Handles: 141949
GPU: NVIDIA GeForce RTX 3060 Laptop GPU
GPU: NVIDIA GeForce RTX 3060 Laptop GPU
Driver version: 31.0.15.4692 Driver date: 30.04.2024 DirectX version: 12 (FL 12.2) Physical location: PCI bus 1, device 0, function 0
Utilization: 2% Dedicated GPU memory: 2,1/6,0 GB Shared GPU memory: 0,3/15,6 GB GPU Memory: 2,4/21,6 GB
EdenSpark Performance Measurements
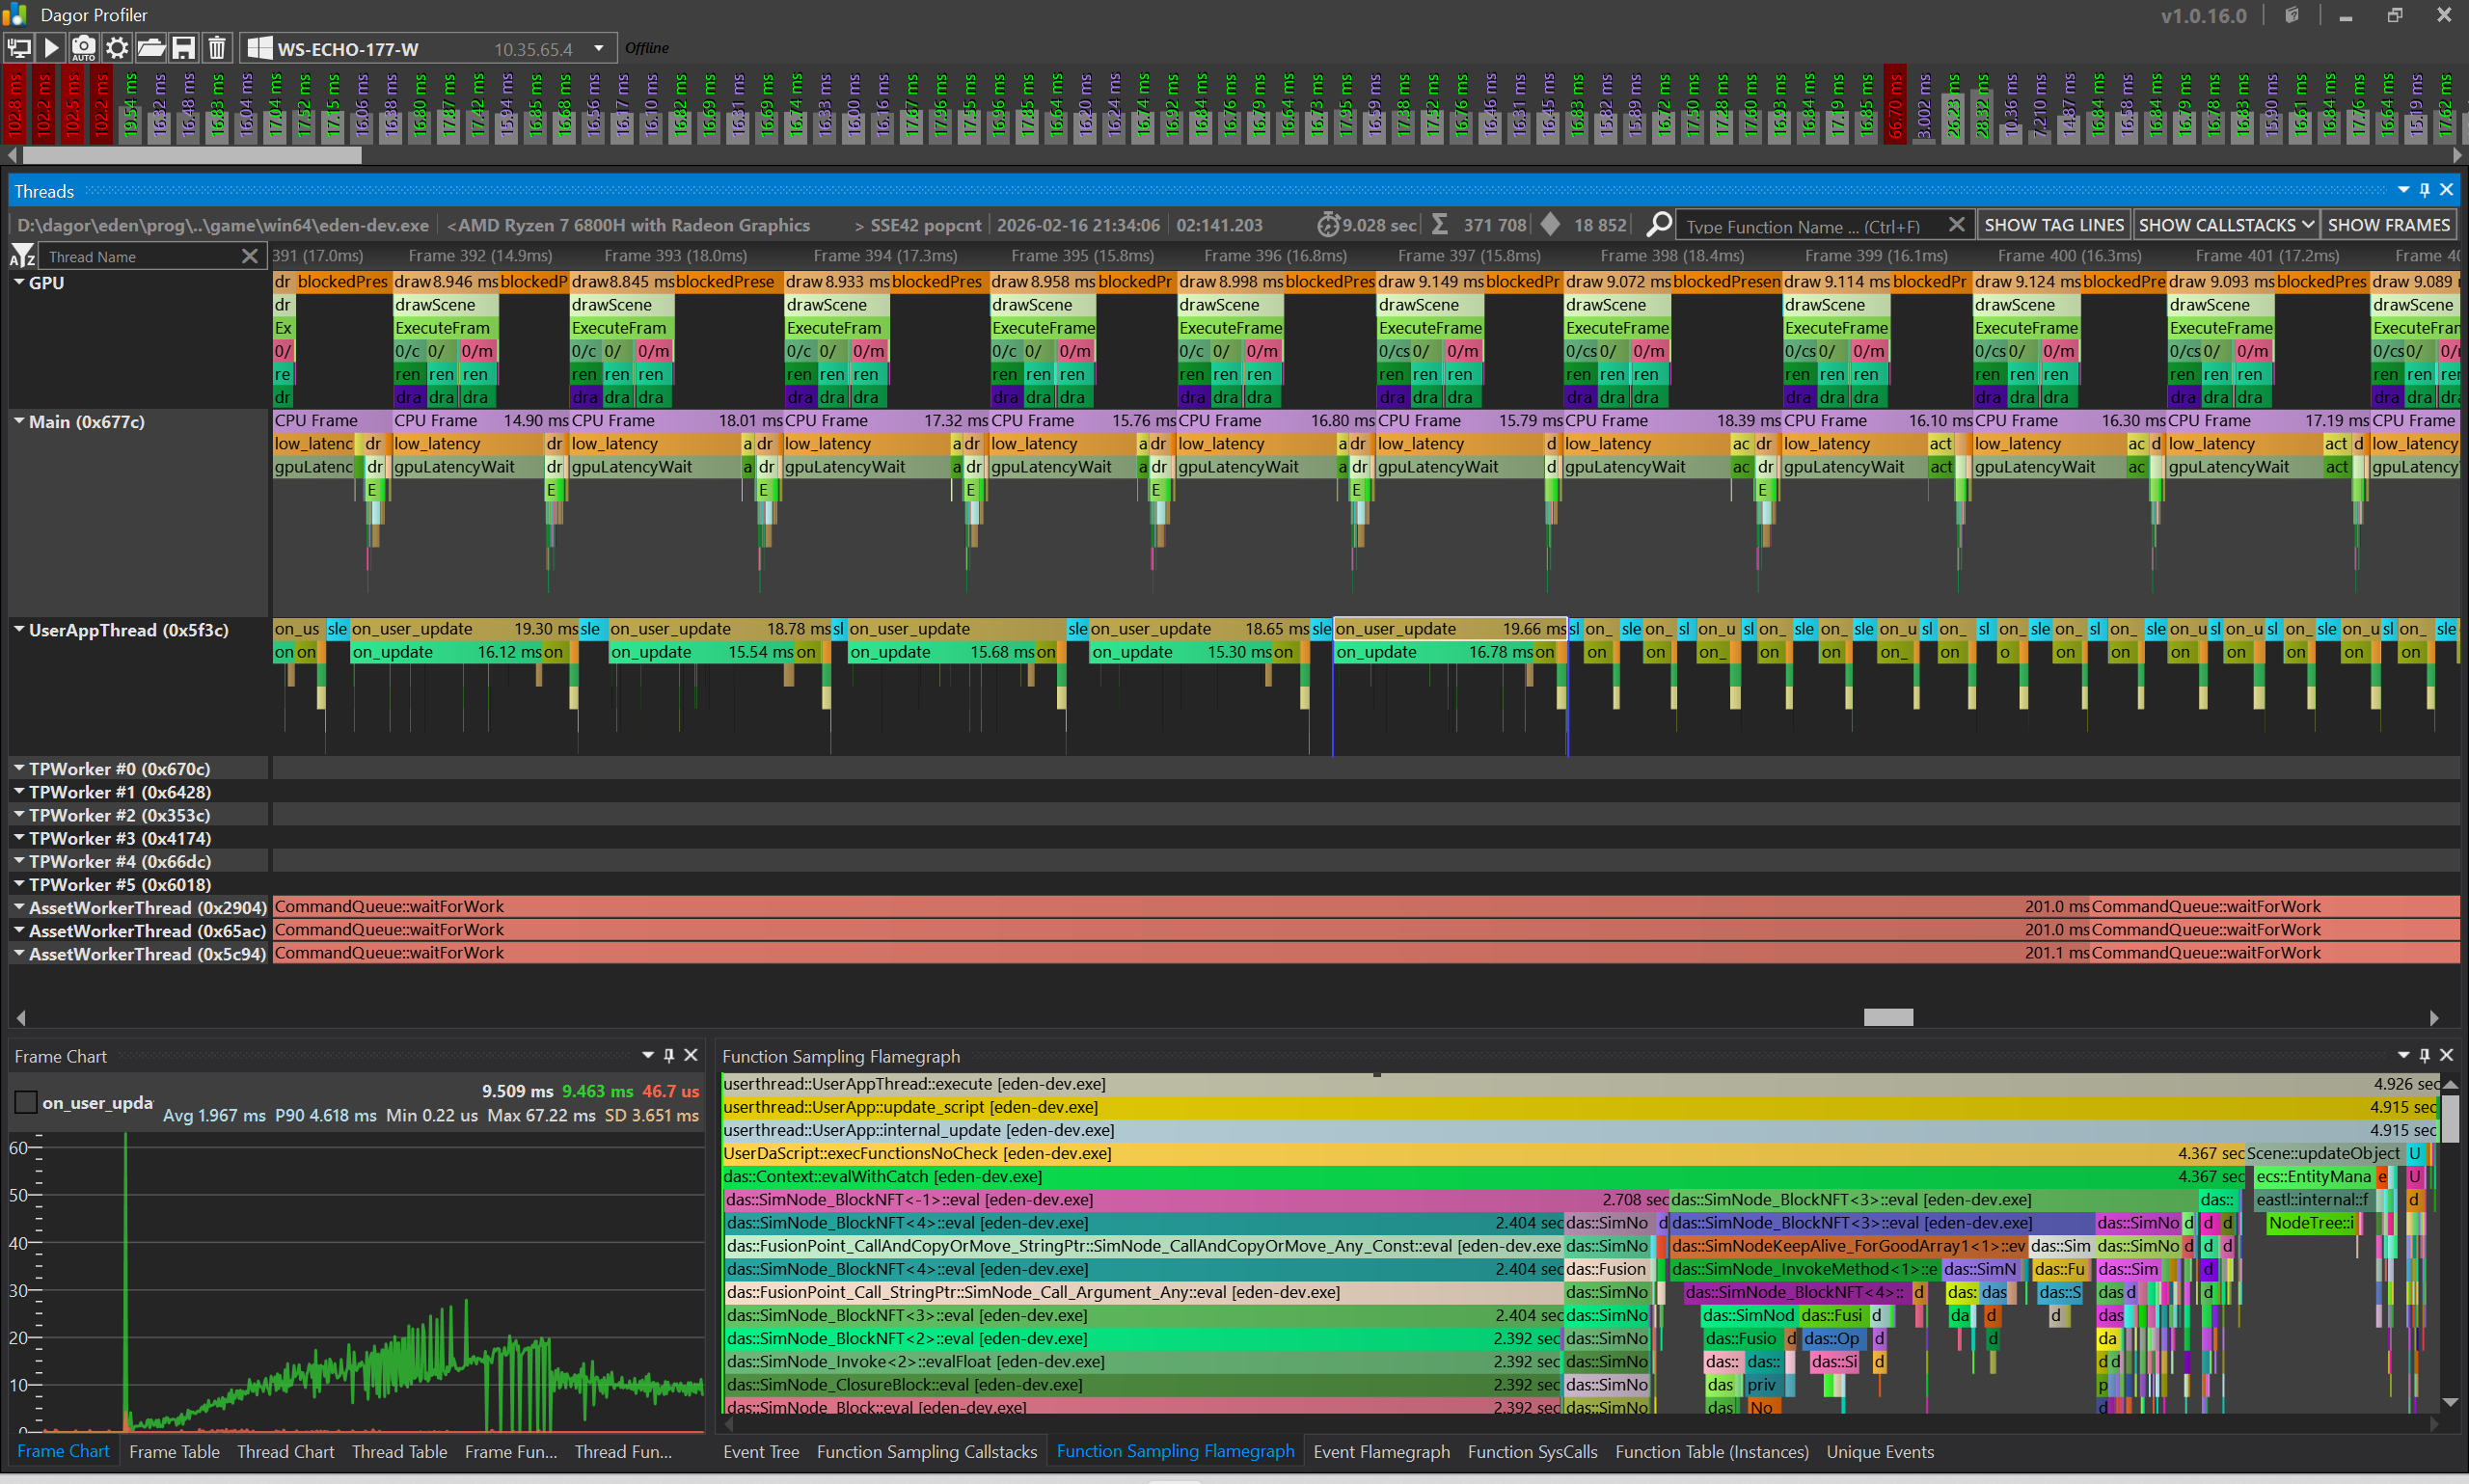
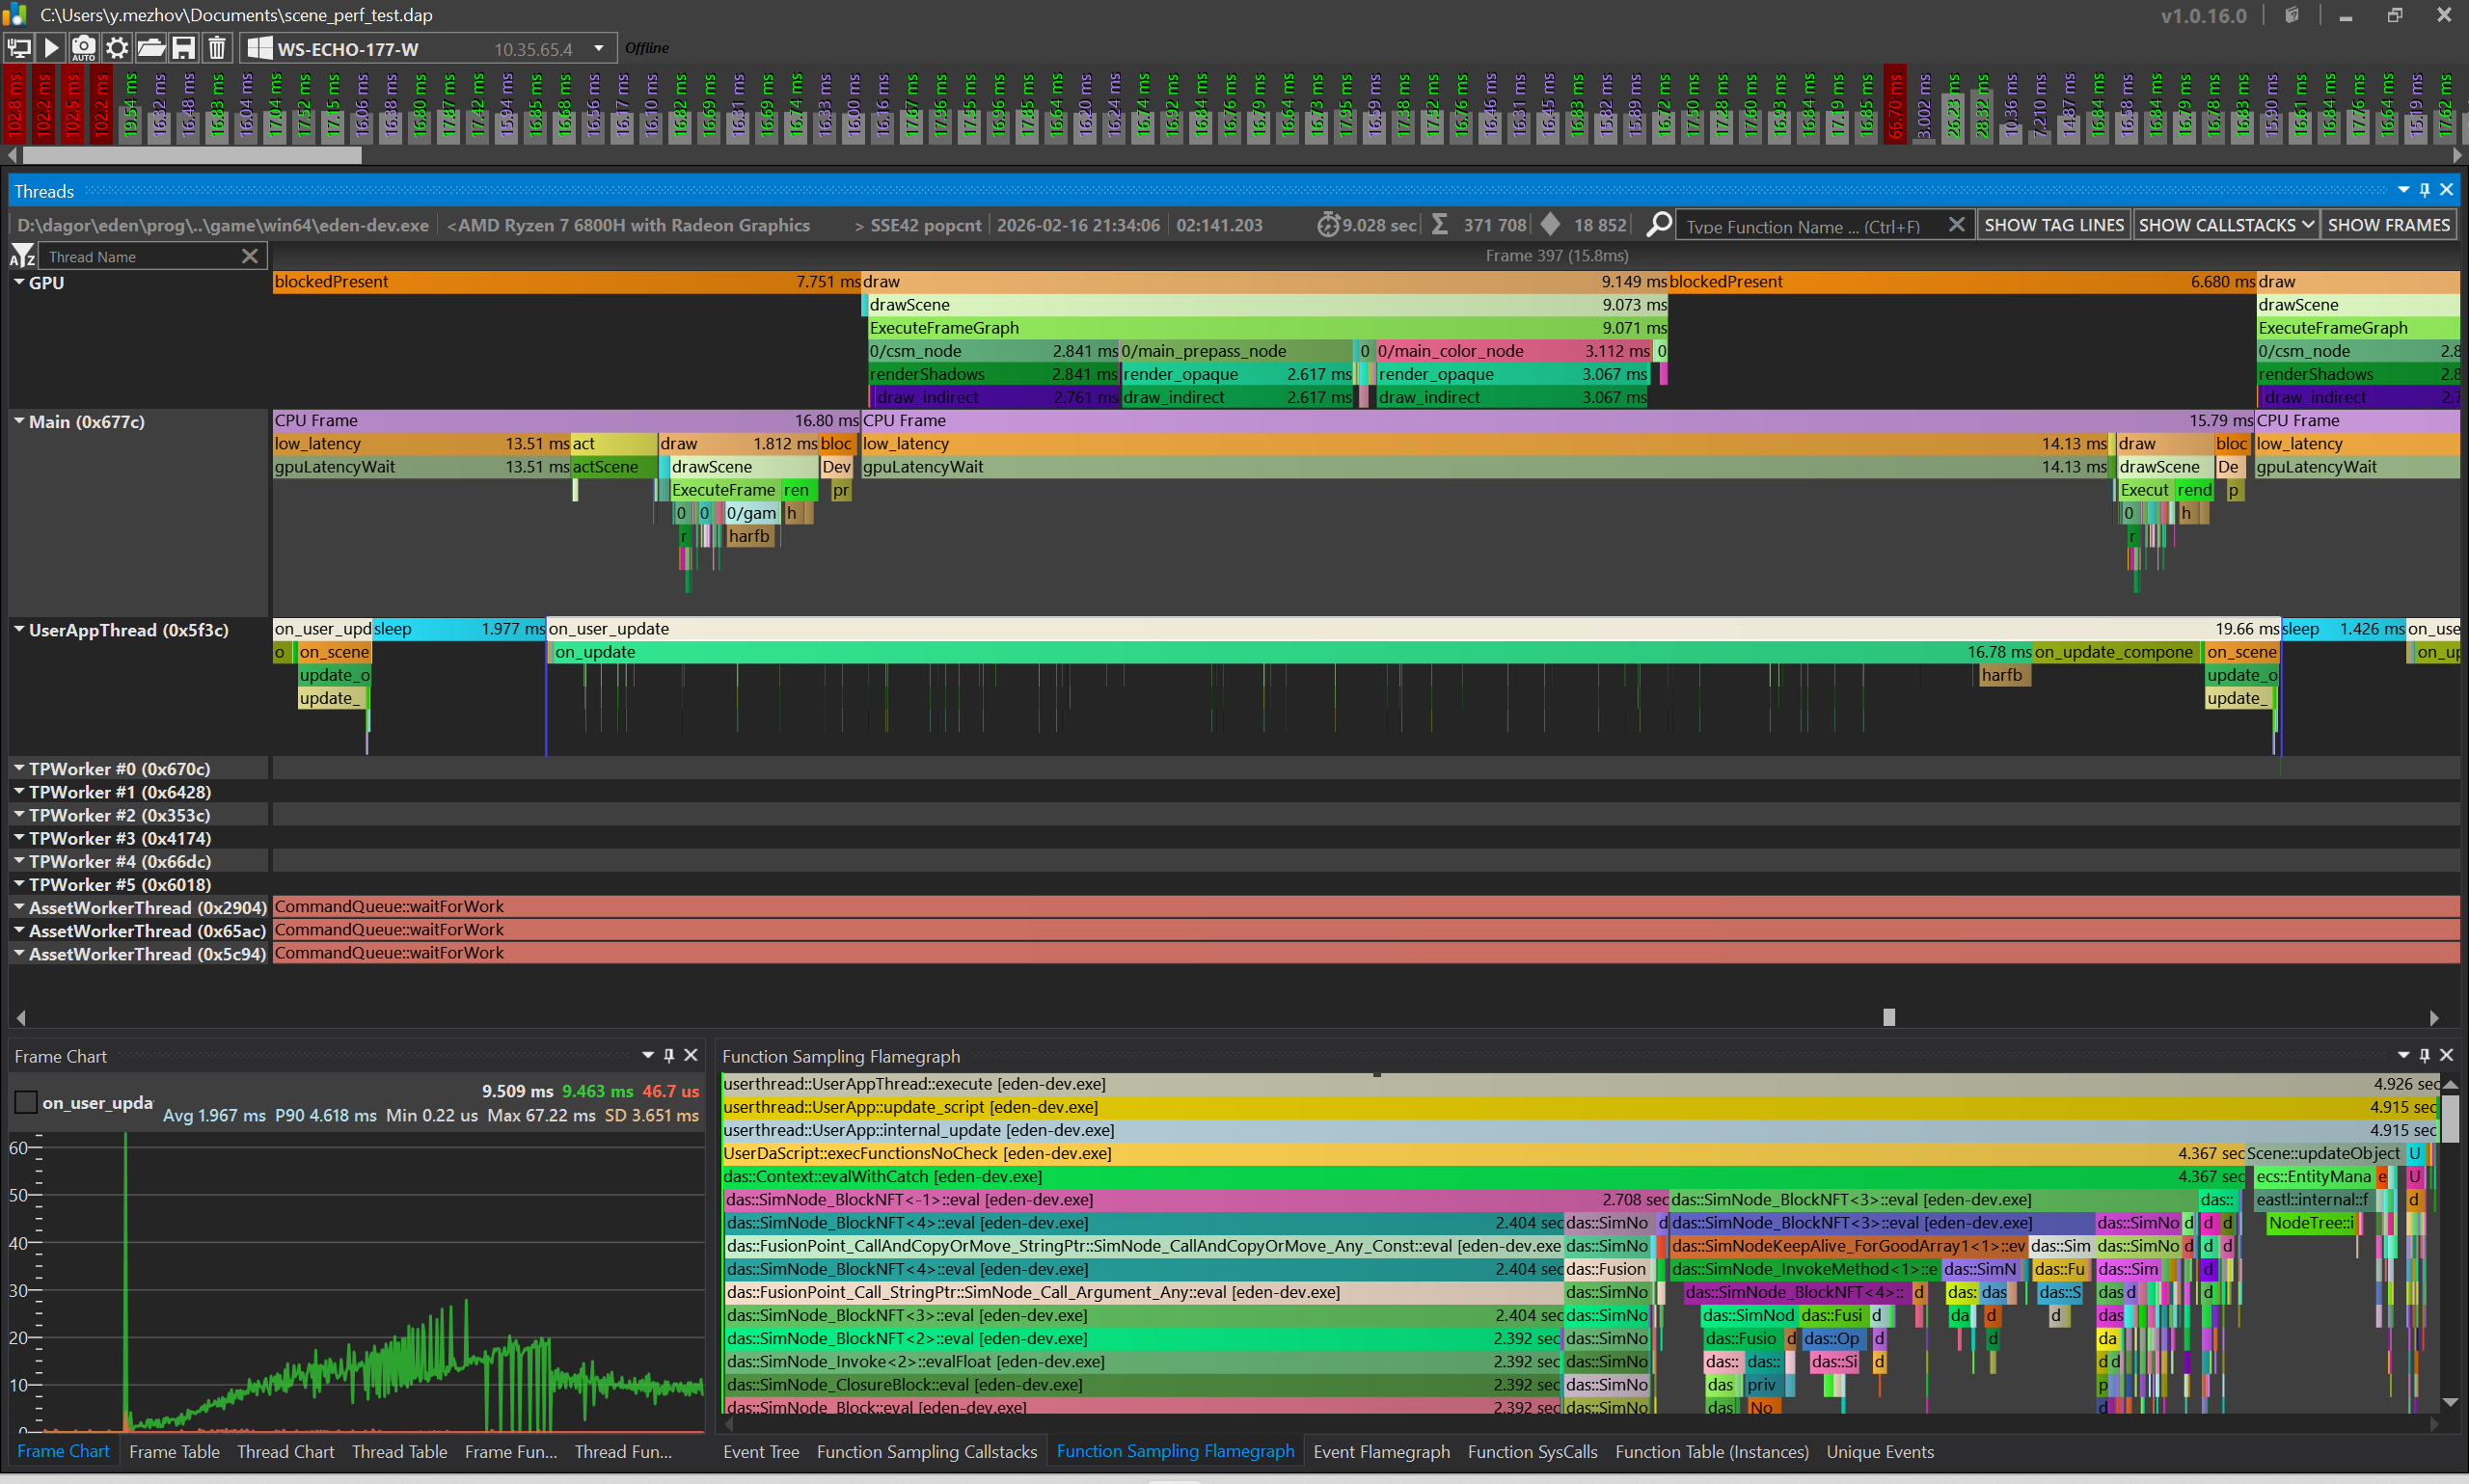
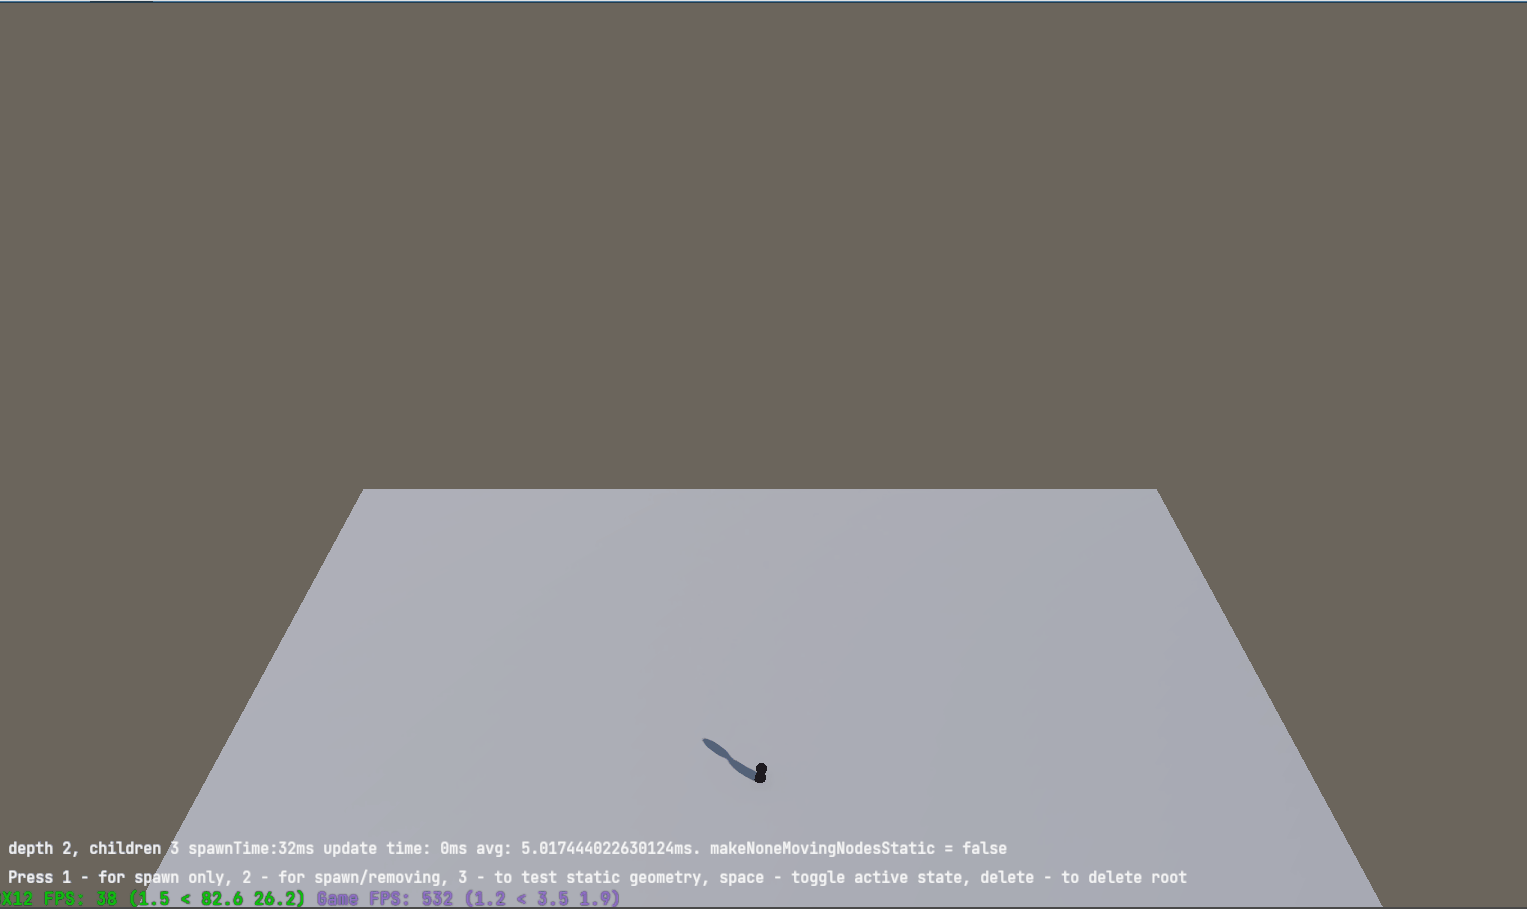
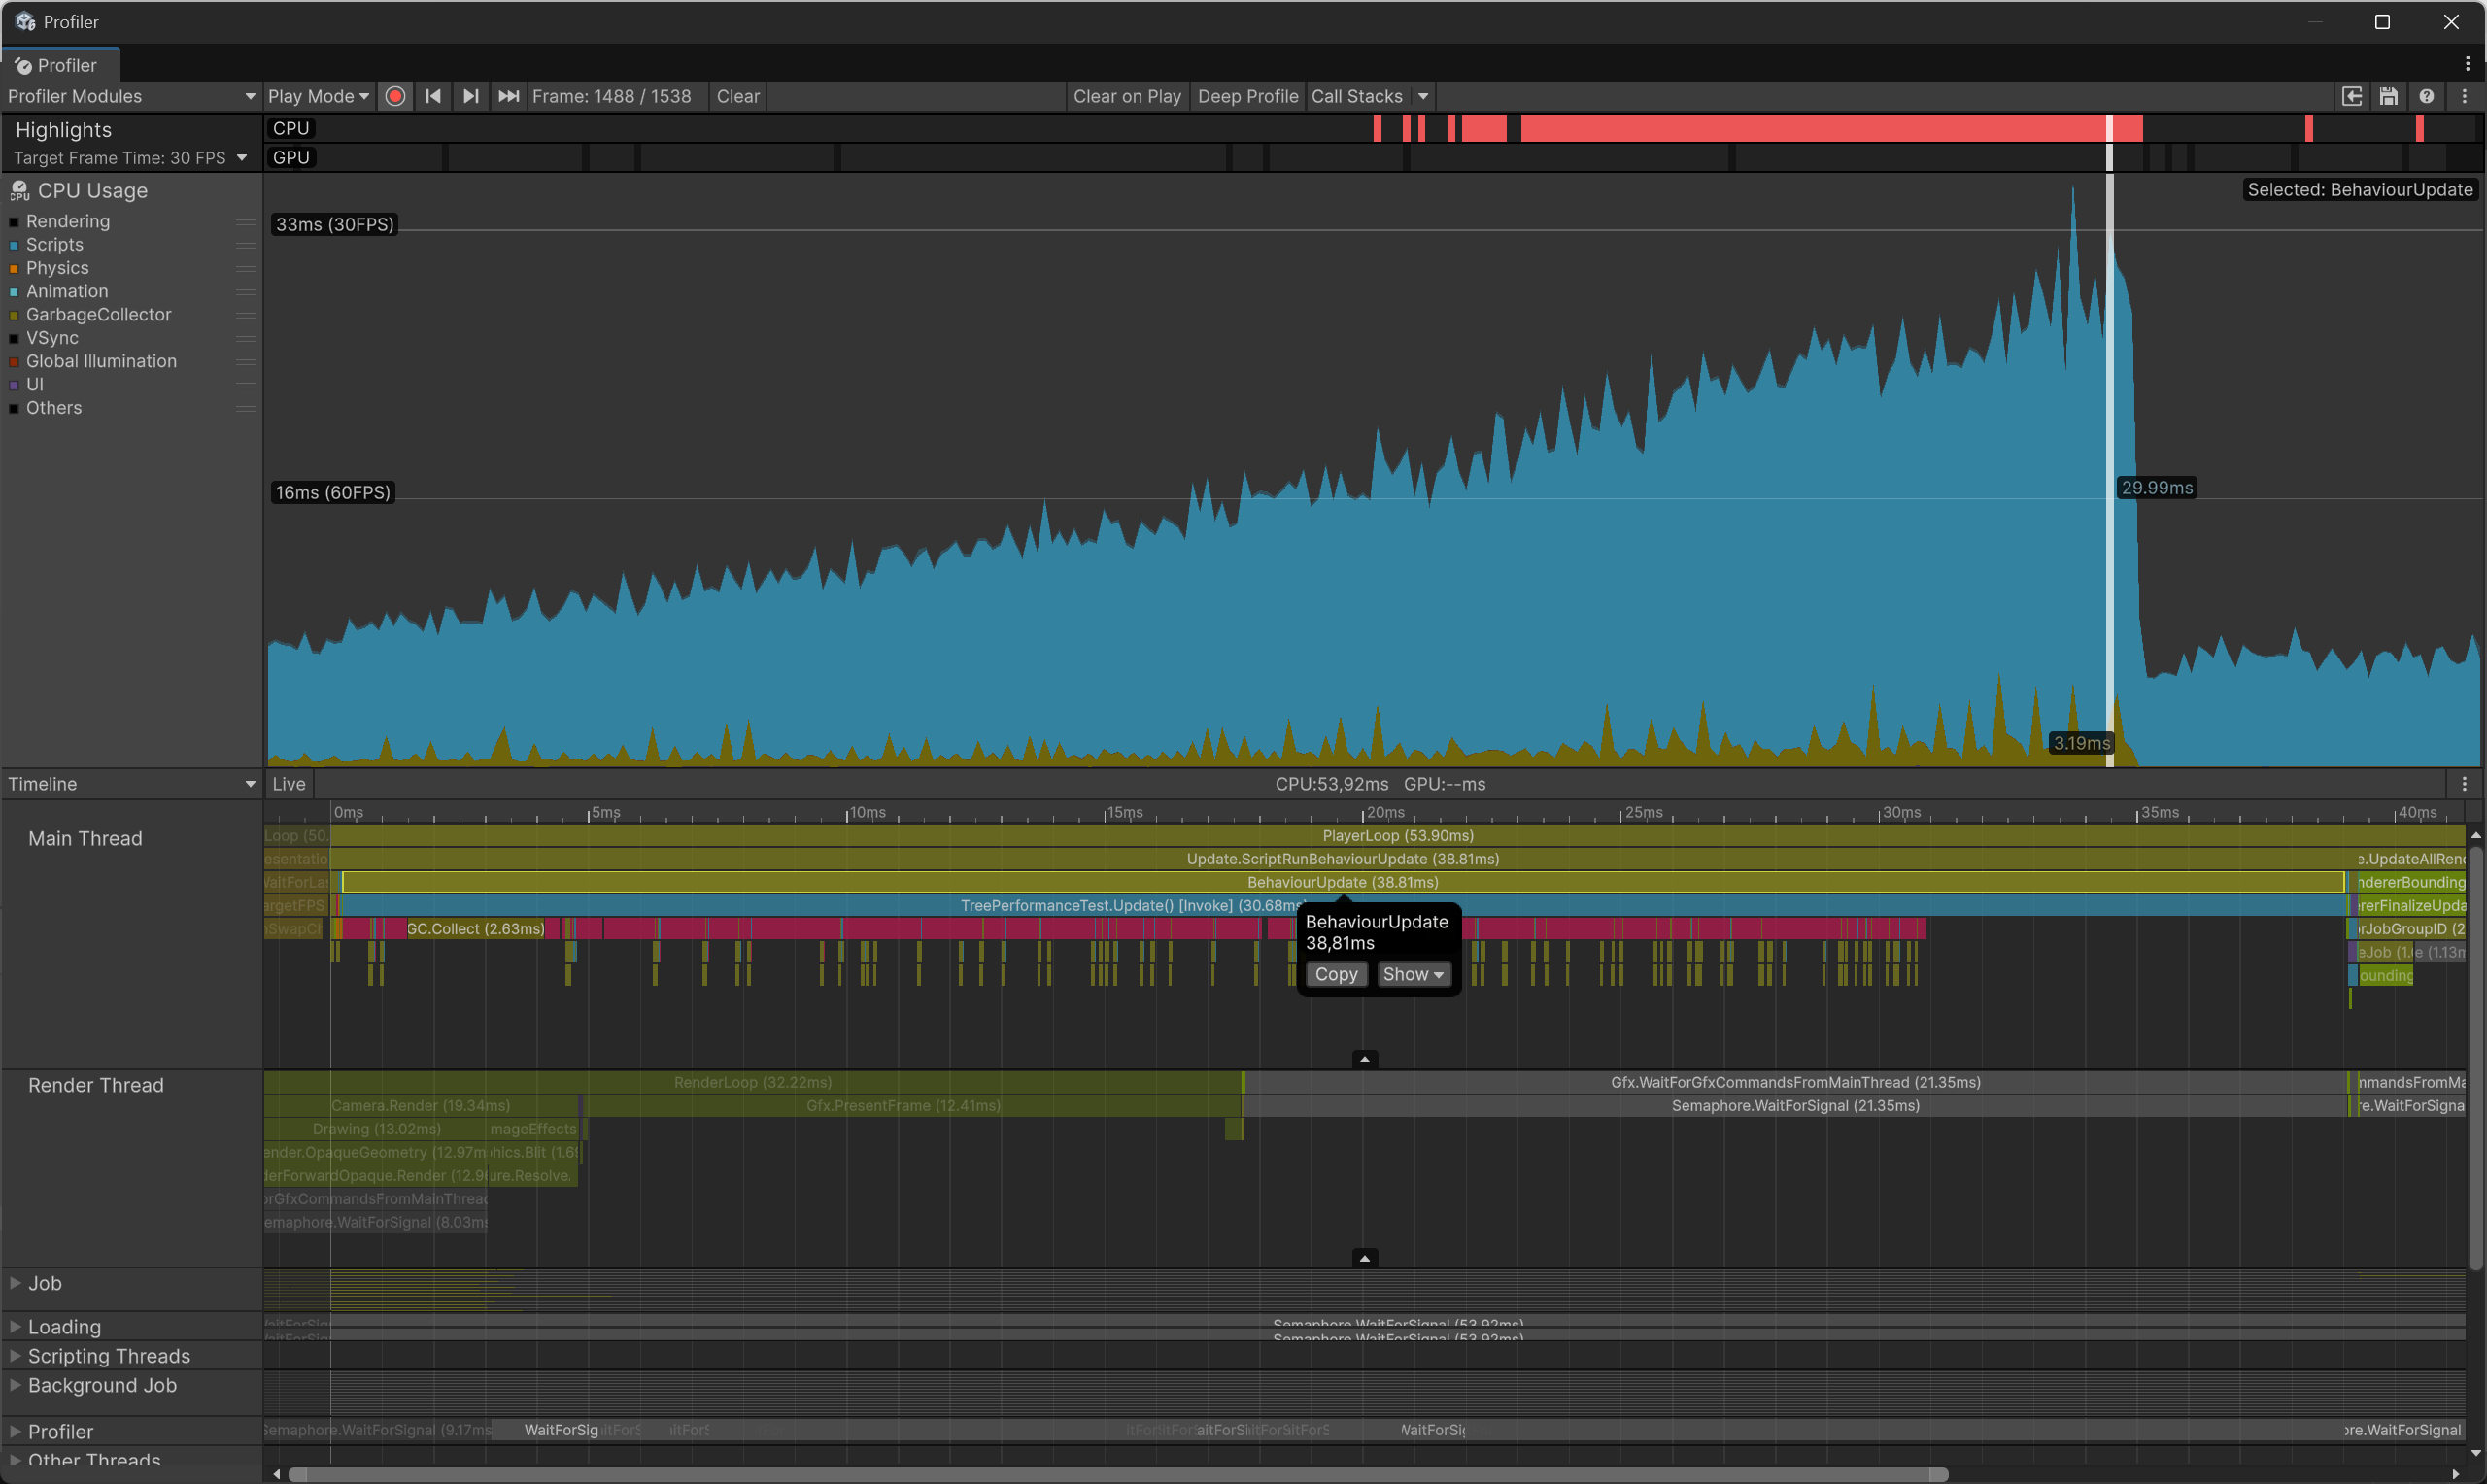
As the point of interest, we will examine the moment in time when the last nodes are created; this moment is clearly noticeable in the profiler; after reaching this point, the load on the CPU decreases significantly.
Let's record the key metrics:
- Updating the user components and code in a separate thread takes 19.66 ms.
- Updating all objects (act) and dispatching draw commands takes 2.88 ms.
- Direct rendering on the GPU in total takes 8.94 ms.
Let’s take this data as a reference point and see what happens in the Unity Engine!
If you are interested in exploring the profile yourself, you can download daProfiler here: https://github.com/GaijinEntertainment/daProfiler.
And the saved profile via the button below.
Unity Engine
As I do not have extensive experience working with the Unity Engine, I asked Copilot to rewrite the code of our stress test from the Daslang language to Unity C#.
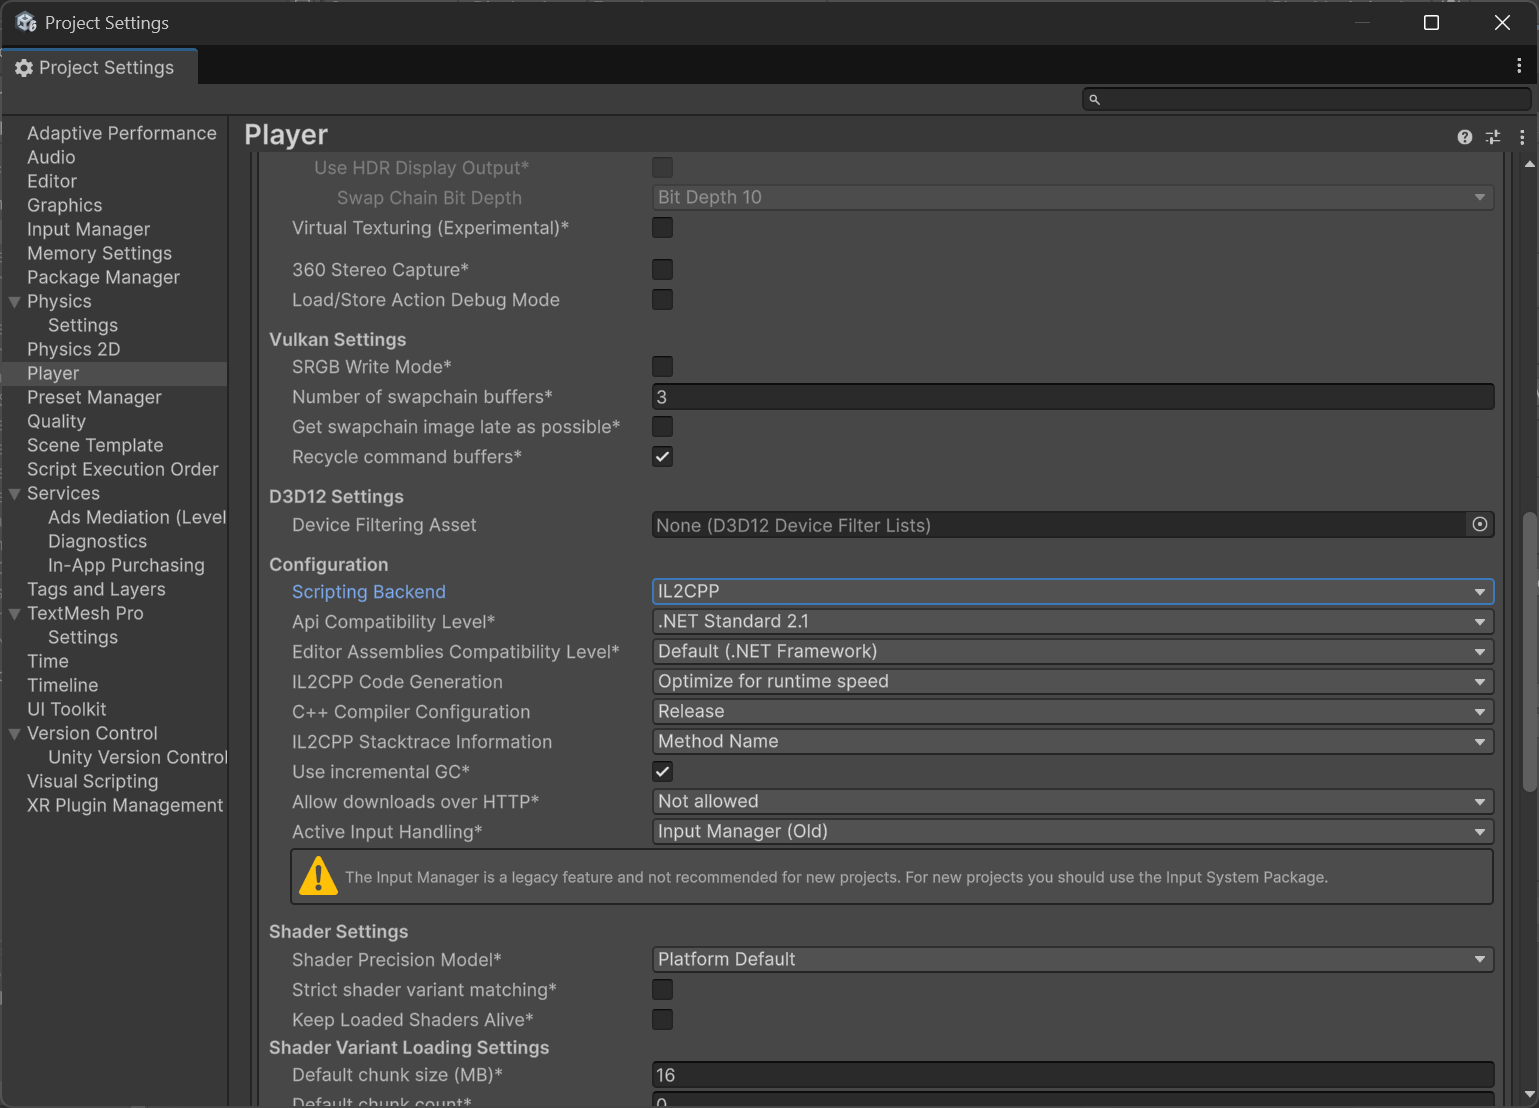
It is very important to note that I took a template with the BuiltIn render pipeline; this can significantly affect the measurement results!
I managed to port the code without compilation errors and with minimal additional actions. I only had to disable the Input System Package and create a couple of nodes for the sphere, floor, and text.
The only thing I had to change for the test to look the same is the approach method, also known as exponential lerp. Copilot generated the following code for this function, but MoveTowards is probably a regular Lerp:
Vector3 Approach(Vector3 current, Vector3 target, float deltaTime, float speed)
{
    return Vector3.MoveTowards(current, target, speed * deltaTime);
}
I replaced it with the following, and Unity began to produce the same result (visually) as EdenSpark.
Vector3 Approach(Vector3 current, Vector3 target, float deltaTime, float speed)
{
    return Vector3.Lerp(current, target, 1.0f - Mathf.Exp(-Mathf.Log(2) * deltaTime / 0.5f));
}
Profiling Unity
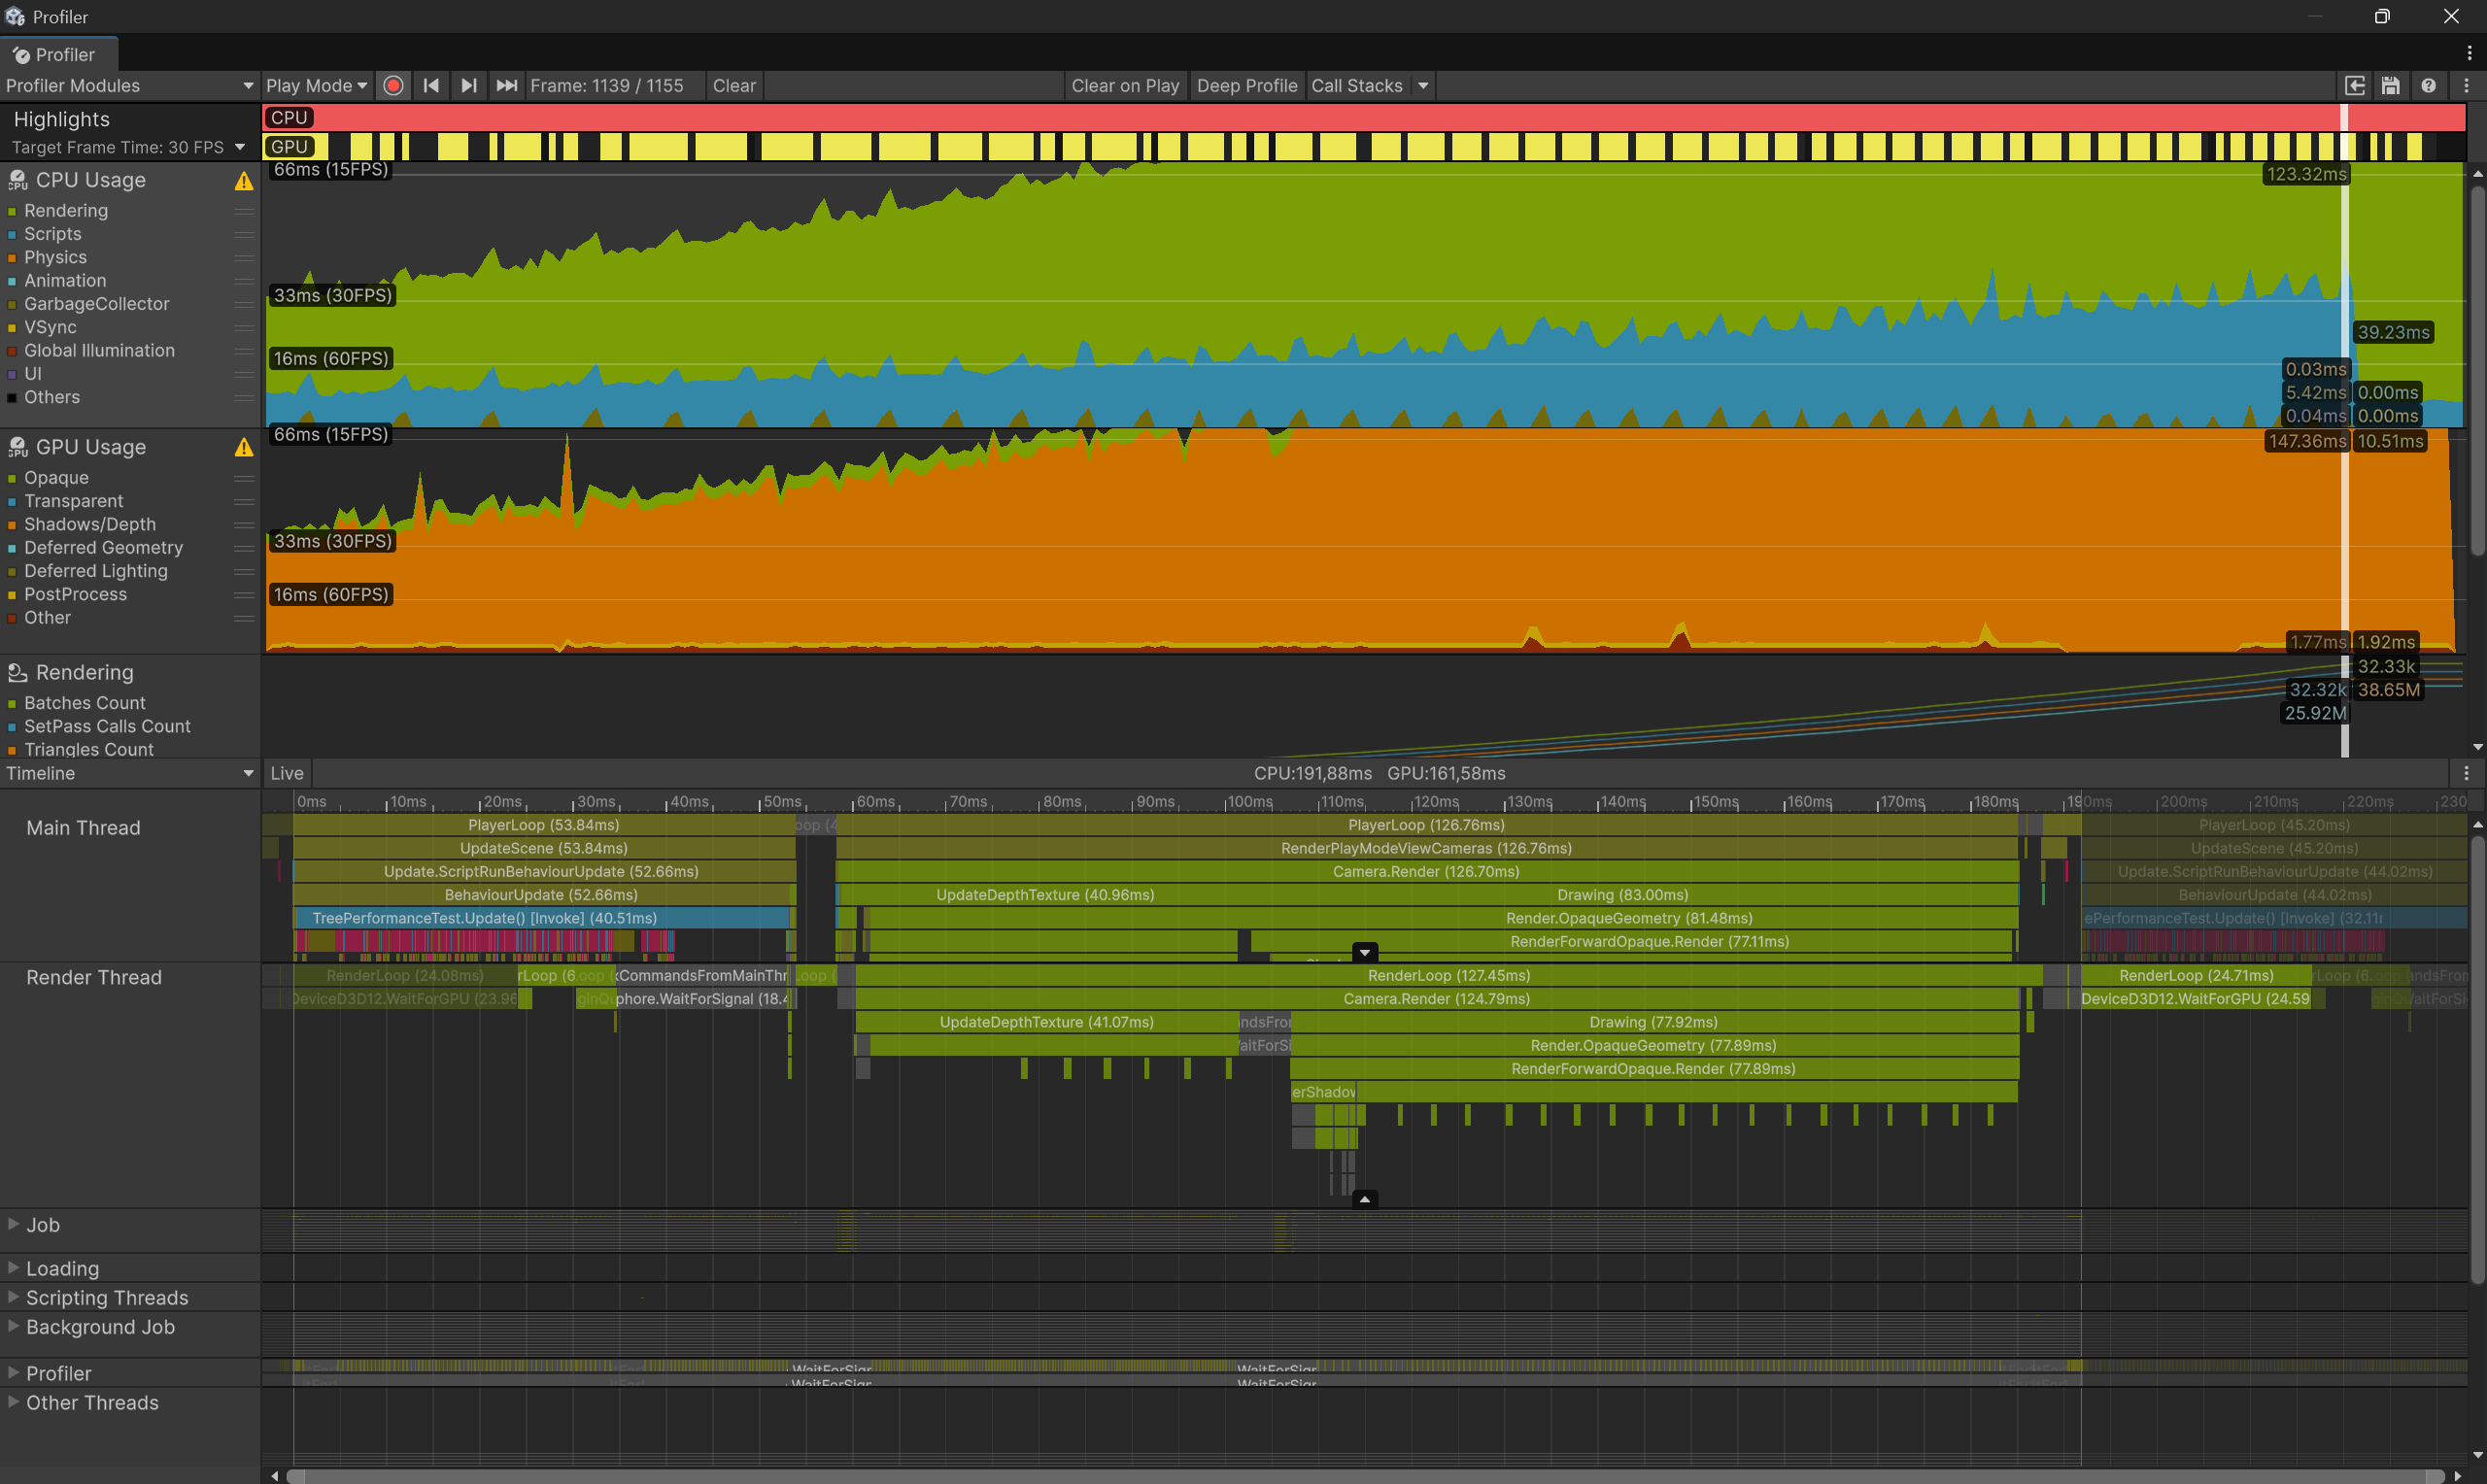
Unity shows the following performance:
- Updating user code: 52.66 ms (2.68 times slower than Eden).
- CPU part of rendering: 126-127 ms (in Main/Render thread) (44 times slower than Eden).
- GPU: 147 ms (16.4 times slower than Eden).
Optimizing Unity
It quickly became clear that Unity wasn't using objects instancing.
My attention was drawn to this piece of code; I asked Copilot to fix it.
Renderer renderer = node.GetComponent<Renderer>();
if (renderer != null)
{
    Material mat = new Material(renderer.material);
    mat.color = color;
    renderer.material = mat;
}
I was offered the following approach based on MaterialPropertyBlock. I liked it and replaced the necessary pieces of code, and also checked the box in the material for “Enable GPU Instancing”.
public class TreePerformanceTest : MonoBehaviour
{
    [Header("Optimization")]
    public Material sharedMaterial; // One material for sharing

    private MaterialPropertyBlock materialPropertyBlock;
    private static readonly int ColorPropertyID = Shader.PropertyToID("_Color");

    void Awake()
    {
        // Create one MaterialPropertyBlock for reusing
        materialPropertyBlock = new MaterialPropertyBlock();

        InitializeInputActions();
    }

    GameObject AddObject(float scale, Vector3 position, Color color, Transform parent = null)
    {
        GameObject node = Instantiate(spherePrefab);
        node.transform.position = position;
        node.transform.localScale = Vector3.one * scale;

        if (parent != null)
        {
            node.transform.SetParent(parent);
        }

        Renderer renderer = node.GetComponent<Renderer>();
        if (renderer != null && sharedMaterial != null)
        {
            // Use shared material
            renderer.material = sharedMaterial;

            // Set actual color in MaterialPropertyBlock
            materialPropertyBlock.SetColor(ColorPropertyID, color);
            renderer.SetPropertyBlock(materialPropertyBlock);
        }

        return node;
    }
}
Profiling Unity with instancing enabled
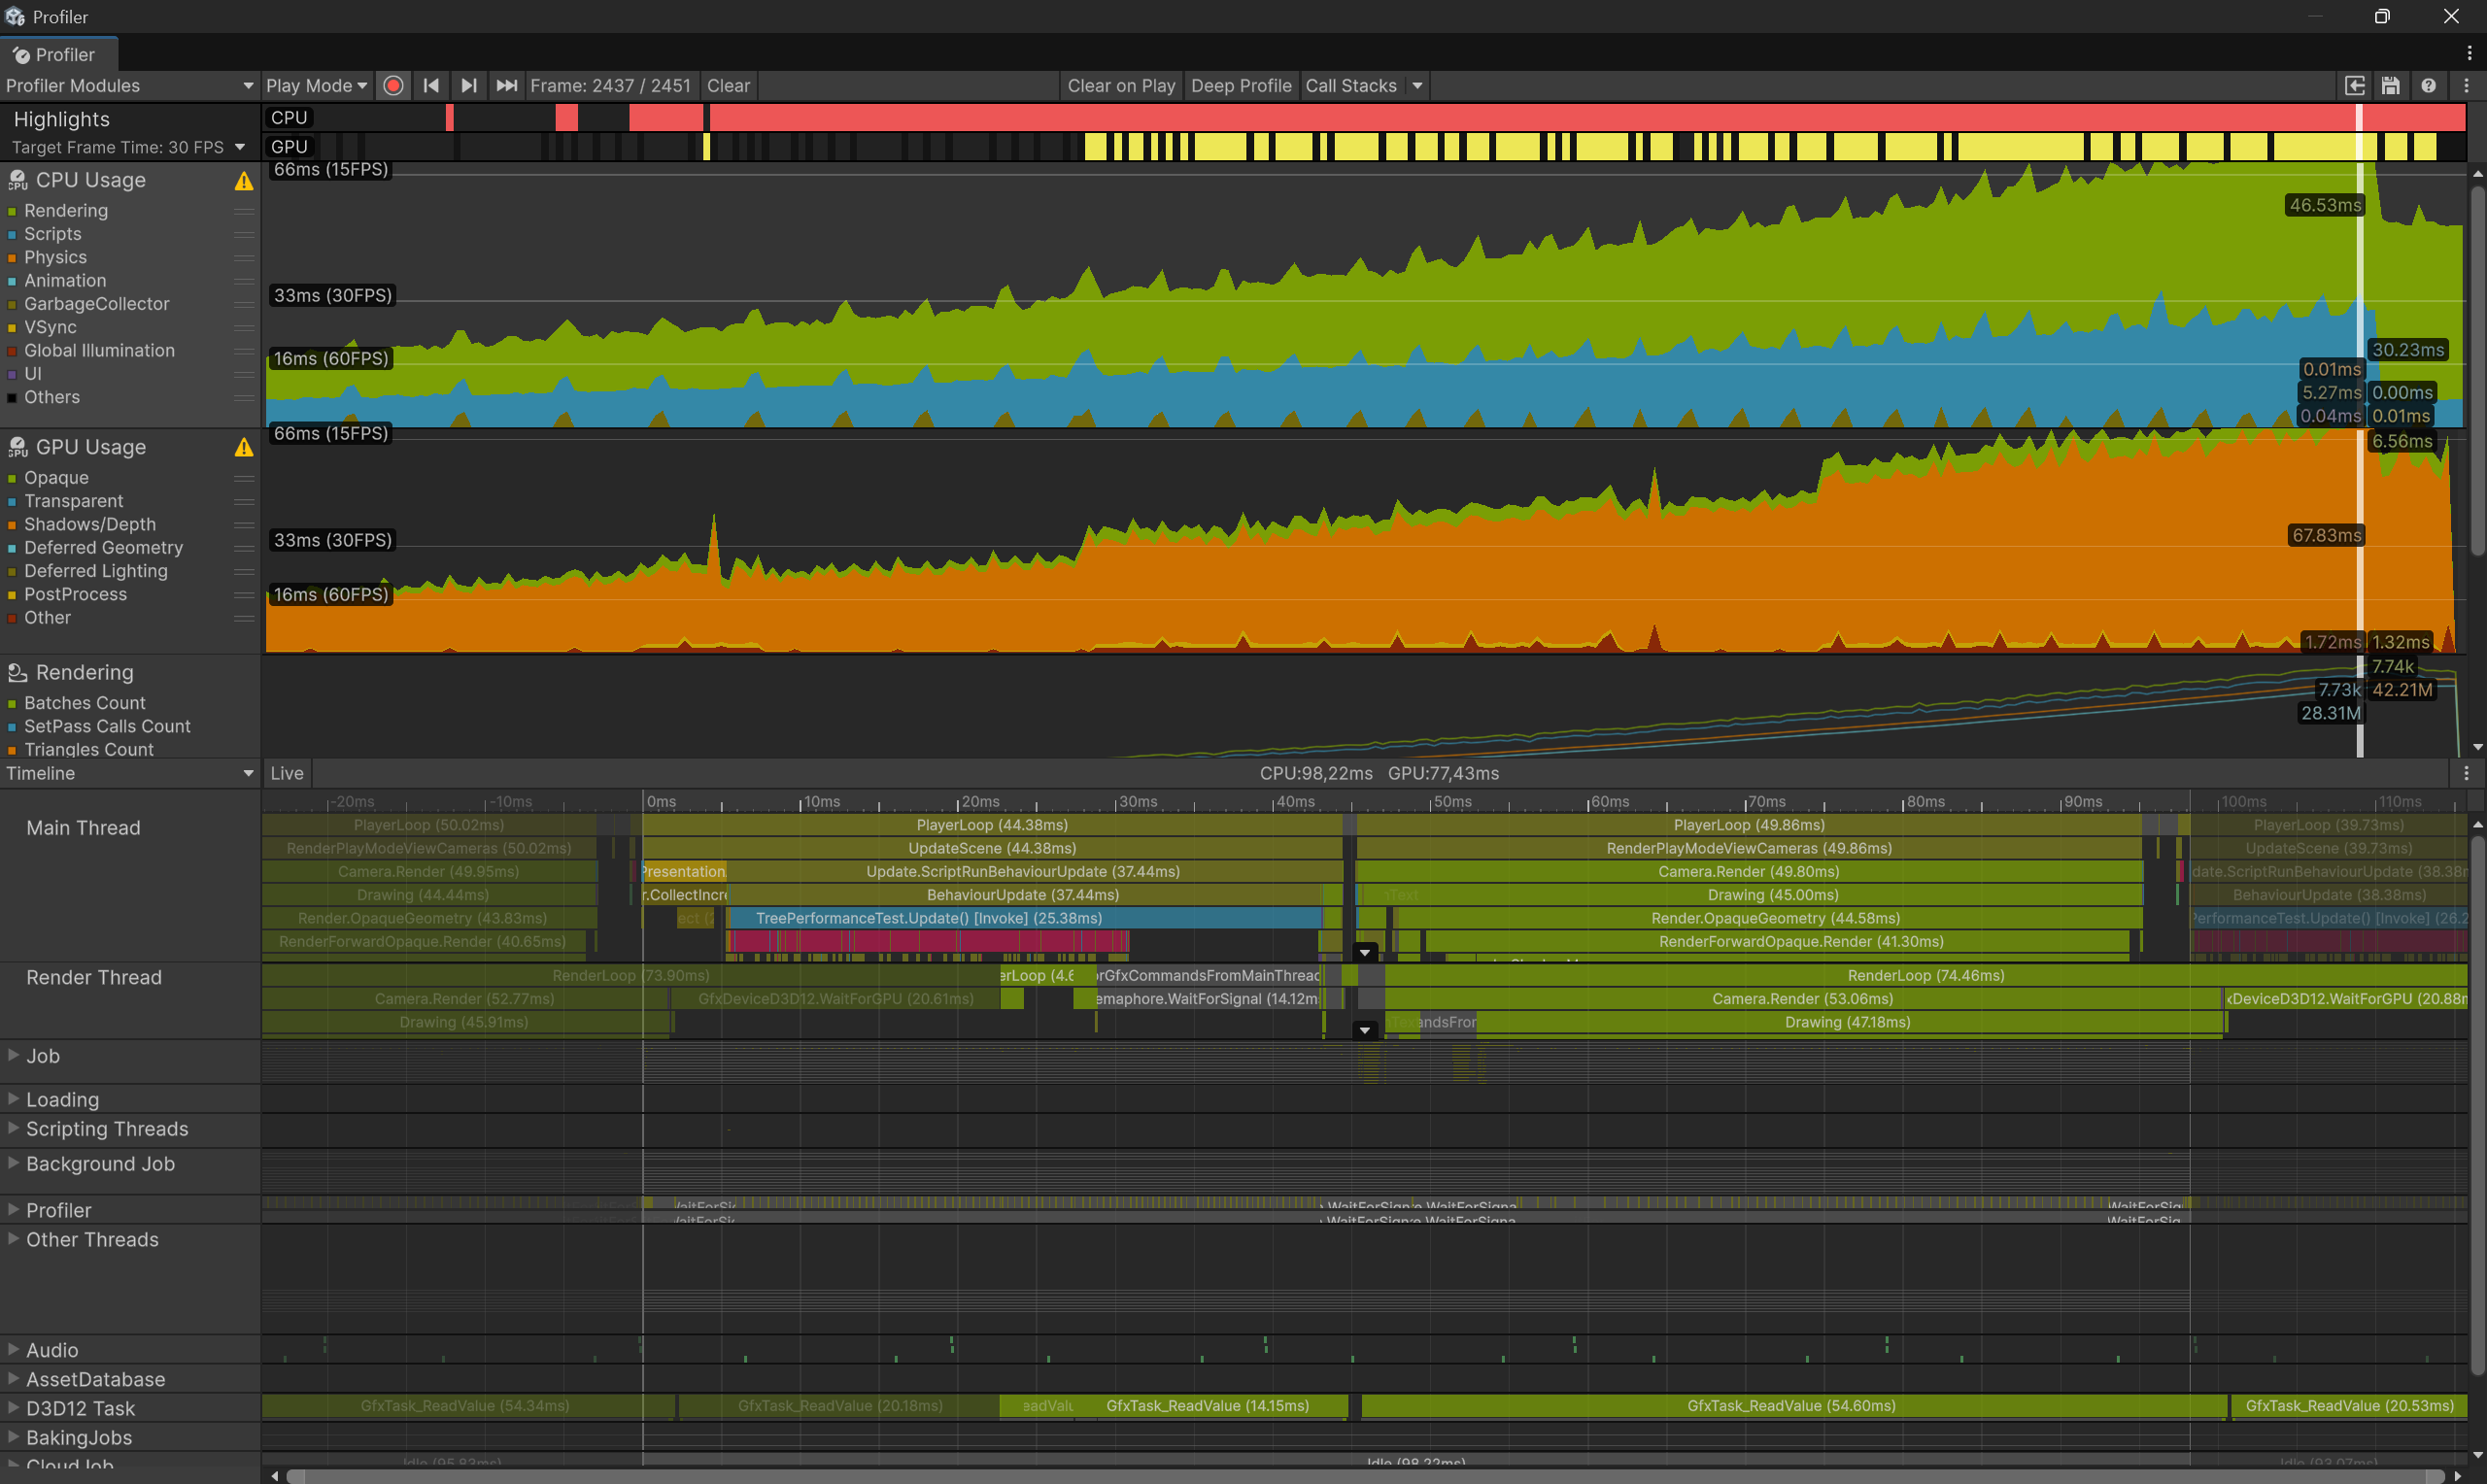
Updated measurements:
- Updating user code: 44.38 ms, whereas it was just 52.66 ms. Possibly a measurement error, or simply performance measurements are unstable at low FPS.
- CPU part of rendering: 50 ms (Main thread) - 74 ms (Render thread) versus 127 ms earlier.
- GPU: 67.8 ms versus 147 ms earlier.
We see that rendering has become twice as fast, but the overall FPS still remains very low.
However, GPU profiling, according to Unity, significantly loads the CPU and makes the CPU profile invalid! Let’s see what happens if we turn off GPU data collection.
The new profile already shows even better results:
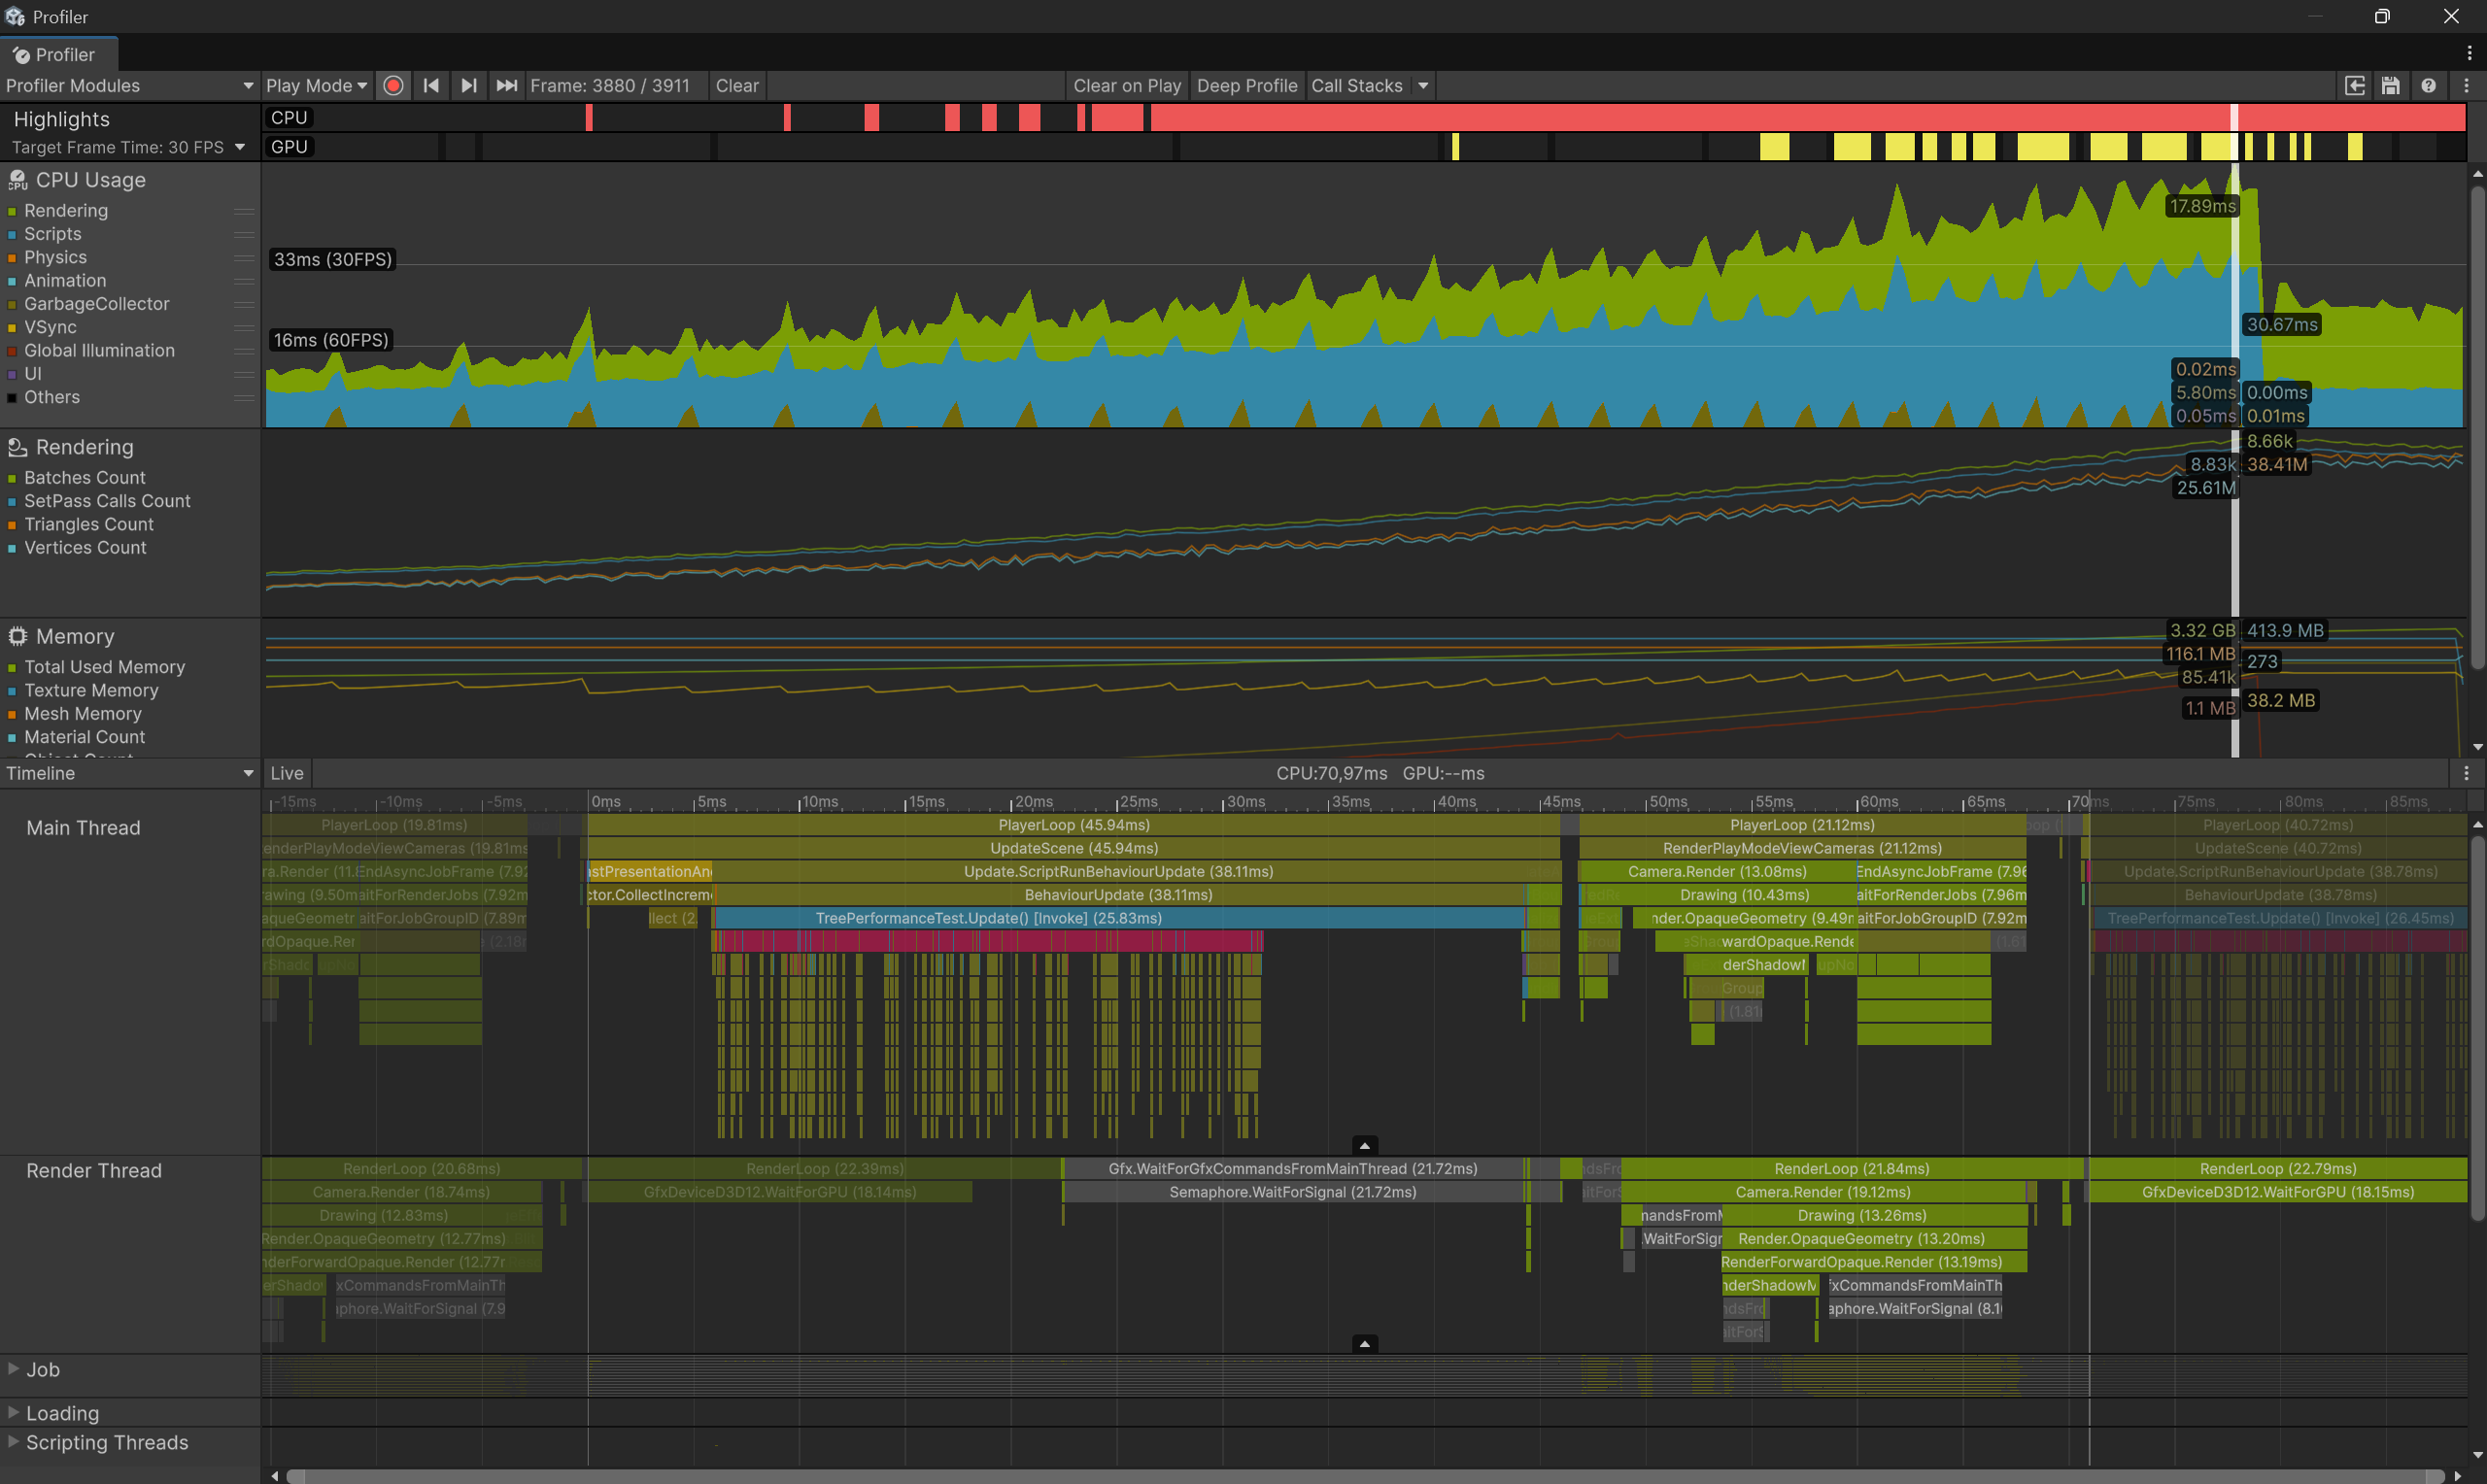
Updated measurements:
- Updating user code: 45.94 ms, in the previous profile 44.38 ms. We see that this code runs quite stably.
- CPU part of rendering: 21.12 ms (Main thread) - 21.84 ms (Render thread) versus 50 ms and 74 ms with GPU profiling.
- GPU: unknown.
It seems we are now profiling something adequate.
I would really like to conclude that the CPU part of rendering in EdenSpark is 7.3 times faster than in Unity (21.12 ms / 2.88 ms), but it’s better to compare our renderer with the Universal Render Pipeline. So I’ll leave the renderer comparison for the next parts of the diary. For now, I’ll focus on comparing the user code.
Unity Release Build
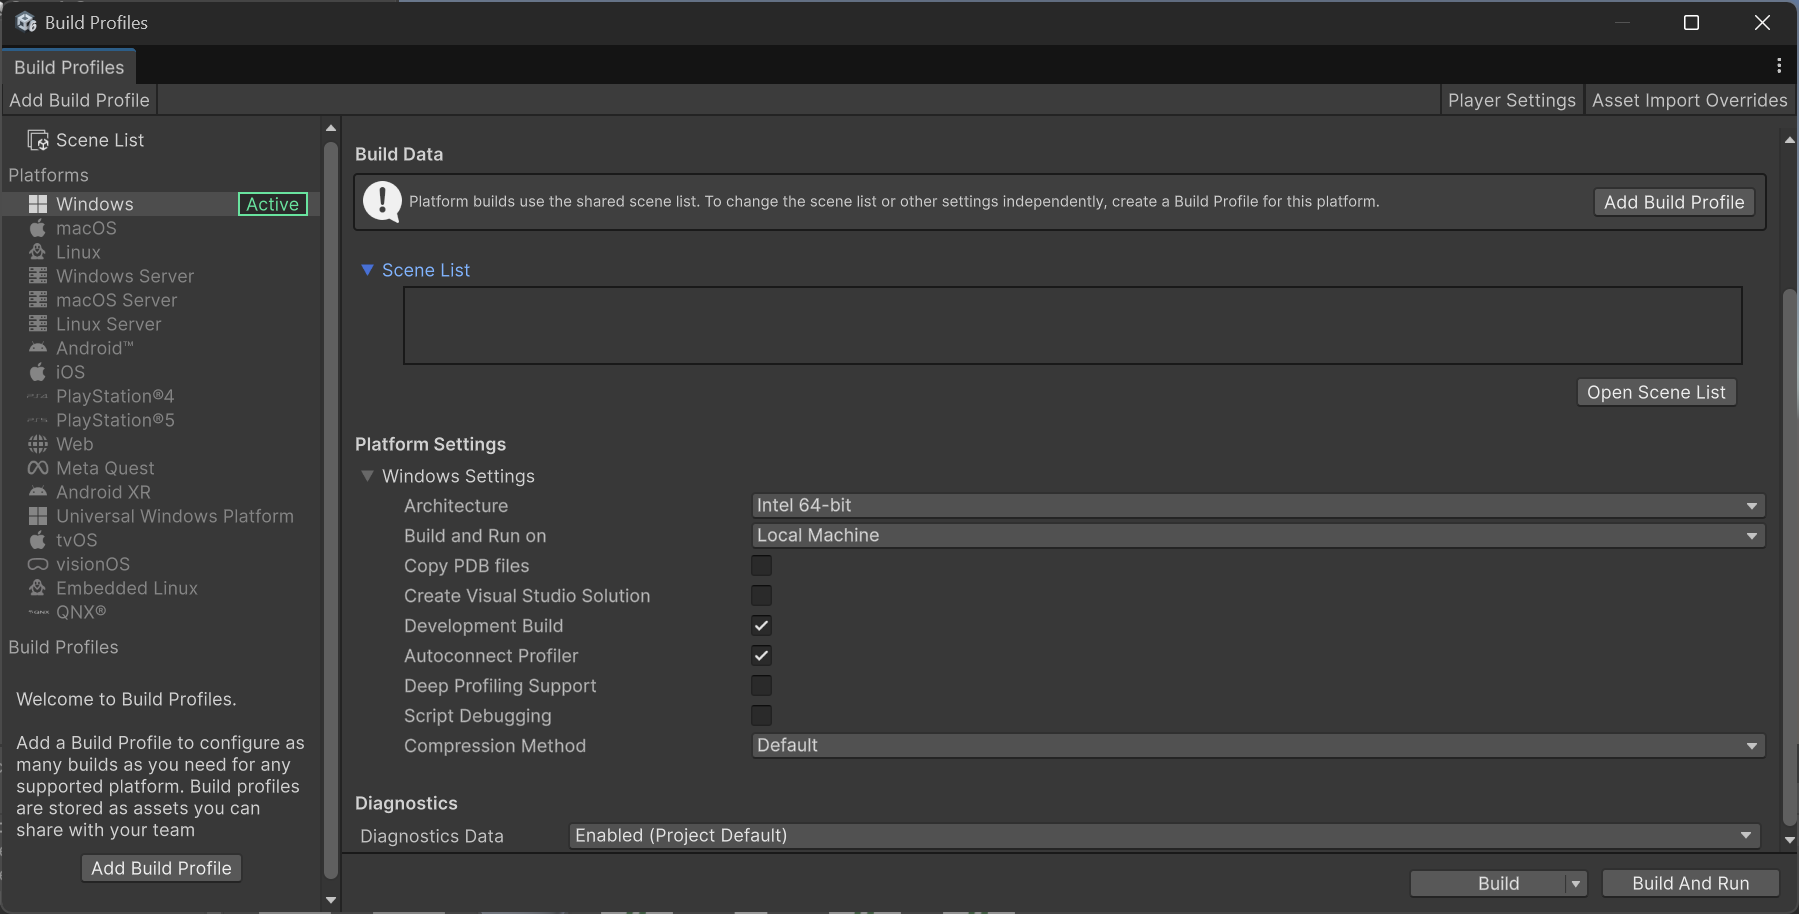
It is known that the Unity editor adds significant overhead to the execution of user code. Therefore, for the purity of the experiment, let’s build a release version of our stress test. We’ll leave the Dev Build checkbox enabled to connect with the profiler.
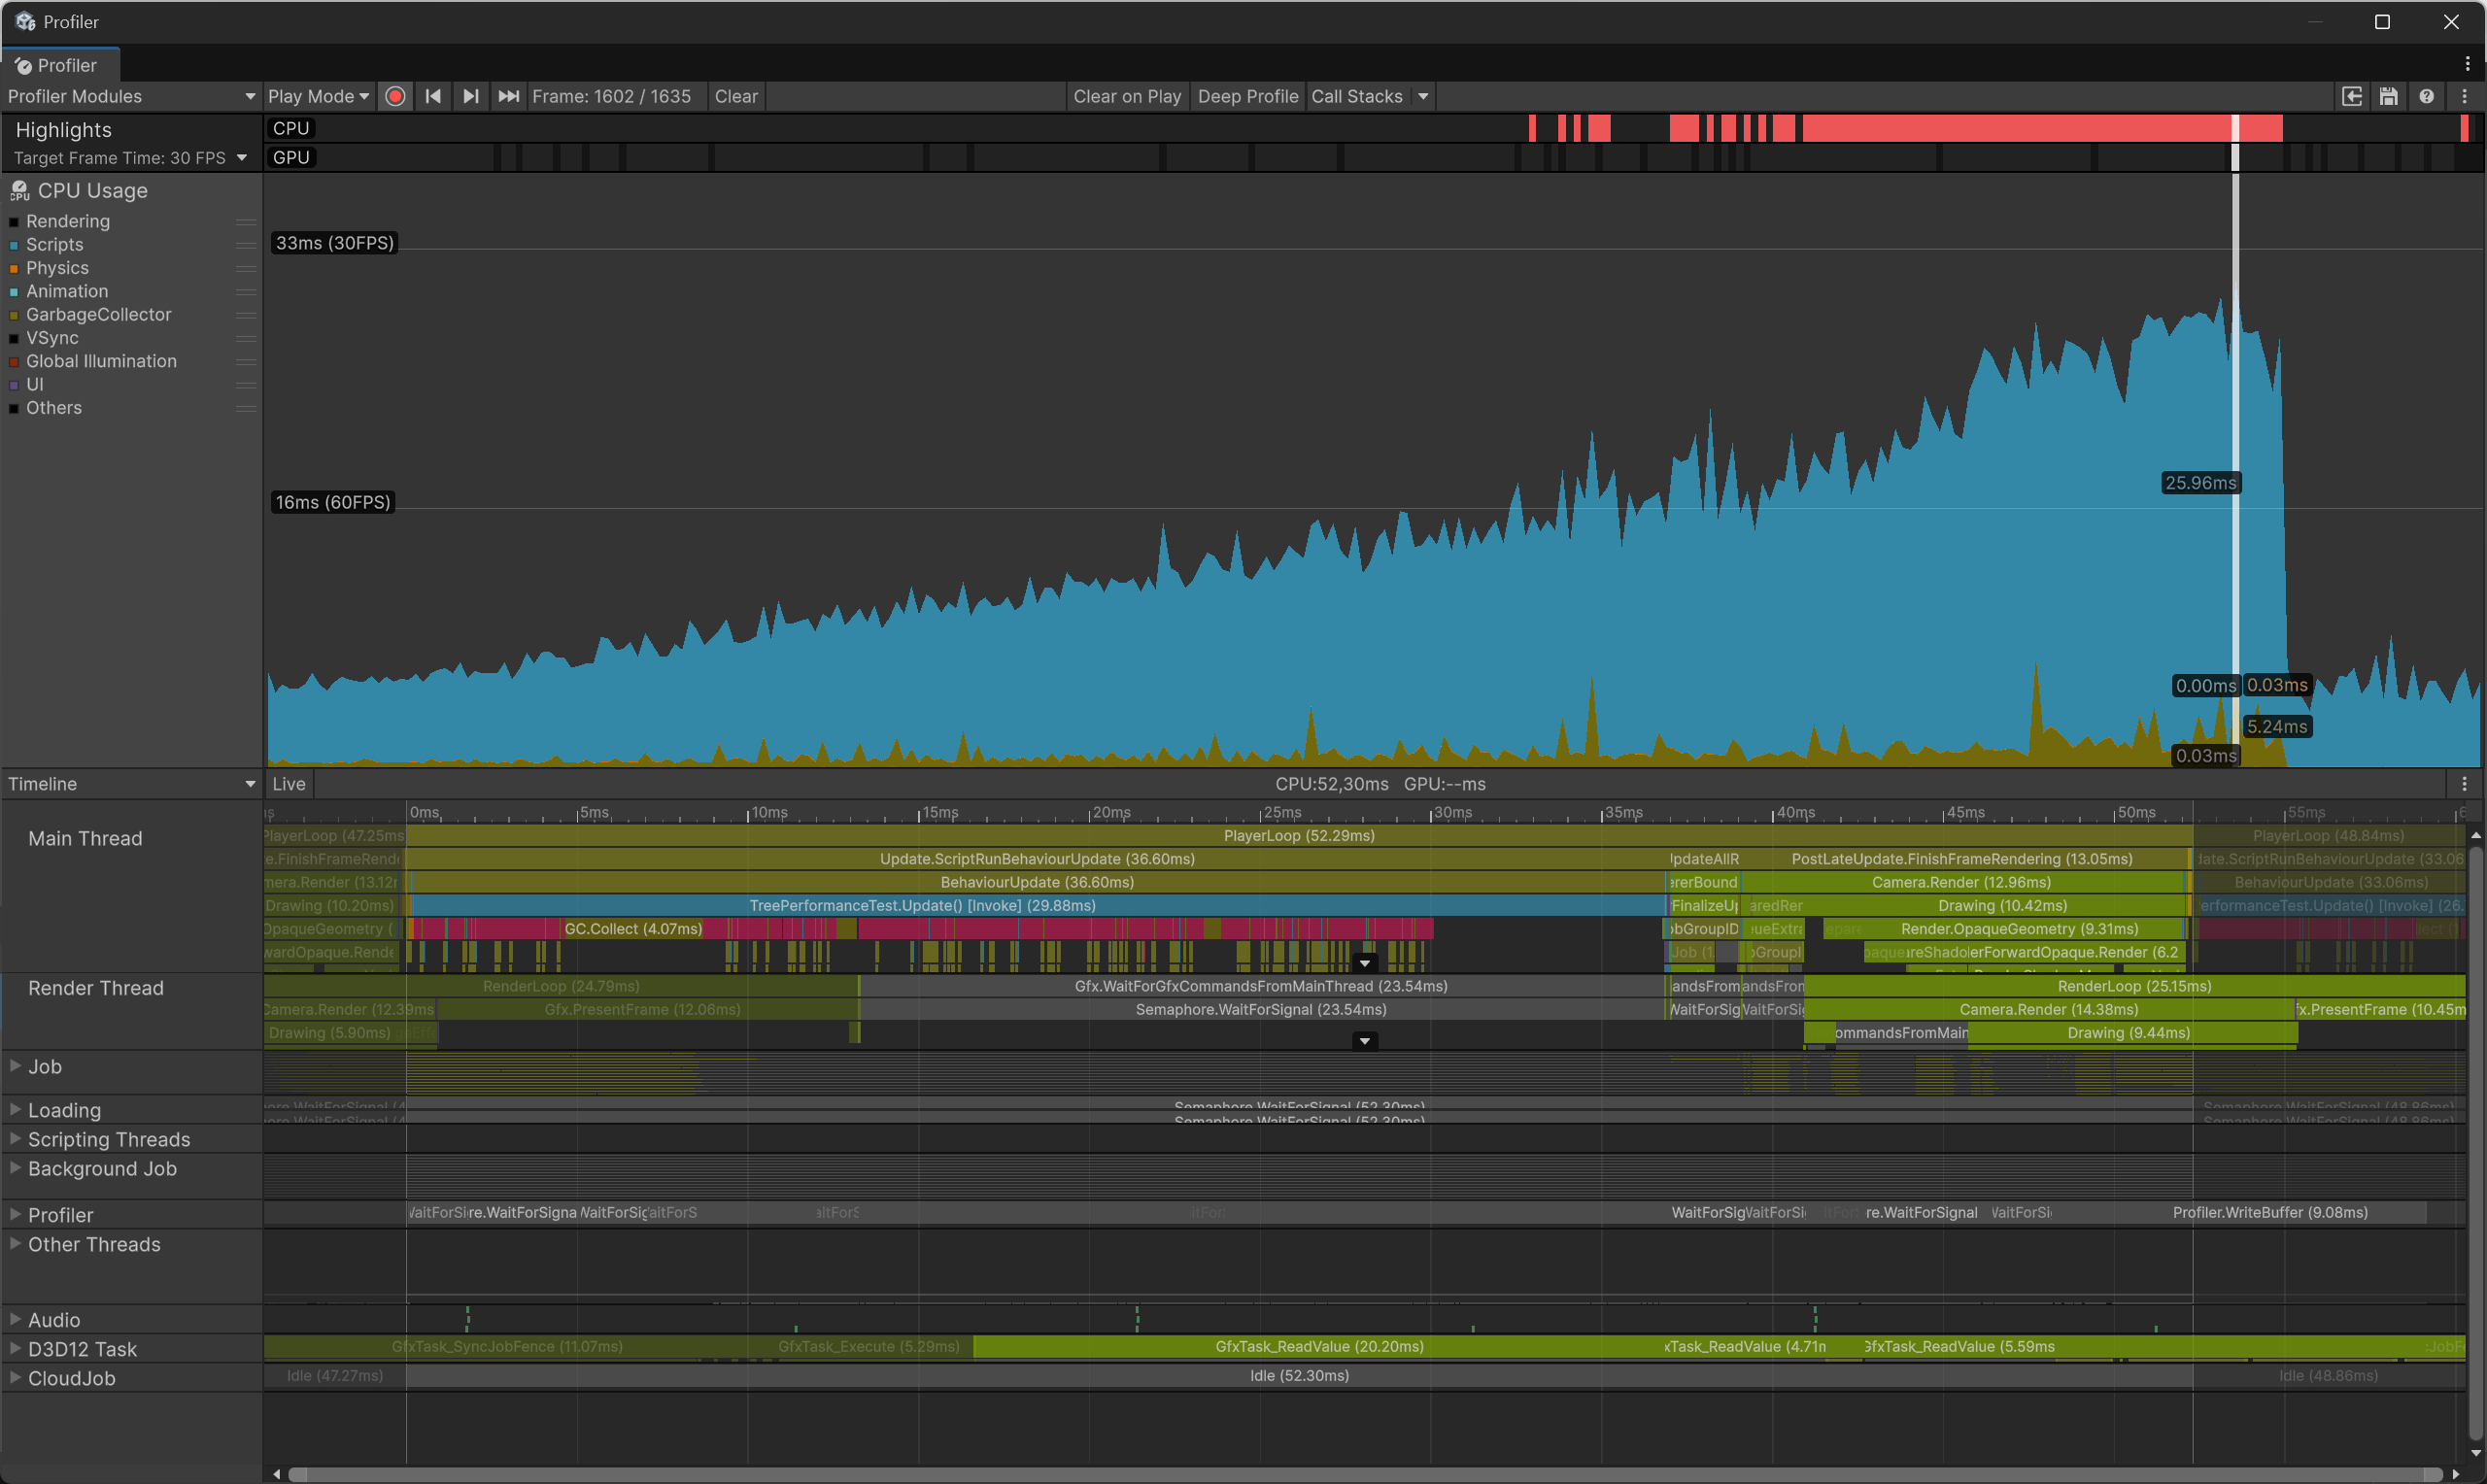
After a successful build, I took measurements and removed everything not related to user code to avoid cluttering the screen:
We get 38.8 ms in Release Unity versus 19.66 ms in EdenSpark.
If we look closely, each frame is divided into 2 parts:
- Updating the tree - recursive traversal of a large tree with the creation of a large number of nodes.
- Updating the position of each object via its on_update/OnUpdate callback.
In Eden (frame 19.66 ms):
- Updating the tree - 16.8 ms (85% of the frame).
- Updating node positions - 1.9 ms (9.6% of the frame).
- Sending updated object transforms to the render thread - 0.8 ms. But we will not compare this render-related part of the CPU work.
In Unity (frame 38.8 ms, 1.97 times slower than Eden):
- Updating the tree - 30.7 ms (79% of the frame). 1.82 times slower than Eden.
- Updating node positions - 8 ms (20.6% of the frame). 4.21 times slower than Eden.
Unity AoT(IL2CPP) Release Build
But let’s give Unity even more advantage and use IL2CPP to perform AoT (ahead of time) compilation of C# to C++.
EdenSpark executes Daslang code in interpretation (JiT is PC-only, and AoT is available for standalone EdenSpark games), so we are giving a significant advantage to Unity!
Regular Release in Unity: 38.8 ms (1.97 times slower than Eden).
IL2CPP Release in Unity: 36.6 ms (1.86 times slower than Eden).
Rendering a large number of similar objects (16k spheres) is difficult for Unity. The speed of the BuiltIn render pipeline on the CPU side is 7.3 times slower compared to the same work in EdenSpark.
Performing tasks such as object instancing, work related to iterating through the scene hierarchy, calling OnUpdate, and changing node transforms in Unity turns out to be 1.86 times slower.
EdenSpark uses the Daslang language in interpretation mode, and it turns out to be almost 2 times faster than C# in AoT execution.